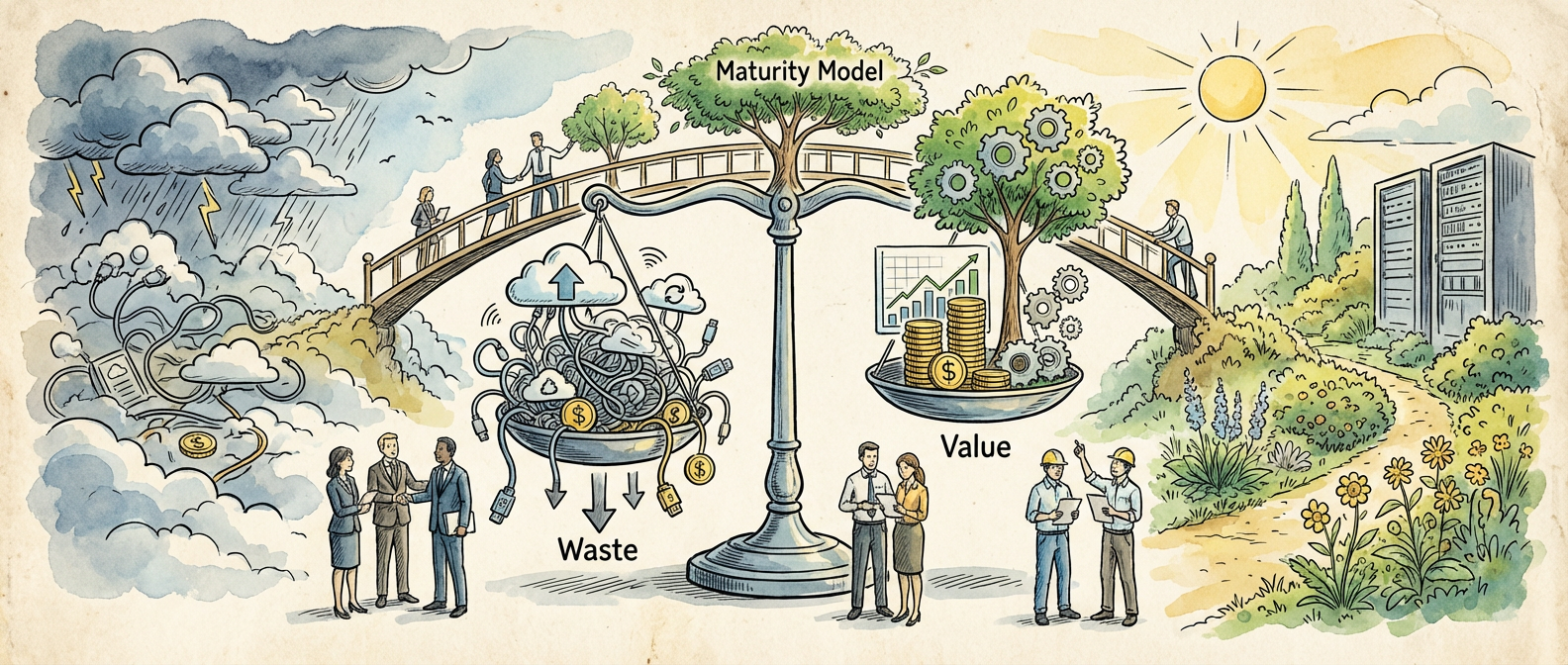
The Compound Interest of Code: Why Incremental Technical Debt Reduction Actually Works

The Hidden Mathematics of Decay

After fifteen years of watching systems evolve from elegant prototypes into sprawling production nightmares, I’ve learned that technical debt operates exactly like financial debt. It compounds. The quick fix you implement today to meet tomorrow’s deadline doesn’t just stay contained to that one module. It spreads through your architecture like water finding cracks in concrete, and six months later you’re debugging issues three layers deep that trace back to that rushed Saturday afternoon when you decided to “just make it work.”

The Compound Interest of Code: Why Incremental Technical Debt Reduction Actually Works

But here’s what most engineering teams get wrong about technical debt management: they treat it like a binary problem. Either you’re adding debt or you’re paying it down. Either you’re in a refactoring sprint or you’re shipping features. This all-or-nothing thinking is why most technical debt initiatives fail spectacularly, burning through weeks of engineering time with little to show for it except cleaner code that still doesn’t solve the real problems.

The teams that actually win at technical debt management understand something counterintuitive. The most effective debt reduction happens in small, consistent increments woven directly into feature development. Not in dedicated cleanup sprints, not in grand architectural rewrites, but in the daily practice of leaving code slightly better than you found it.

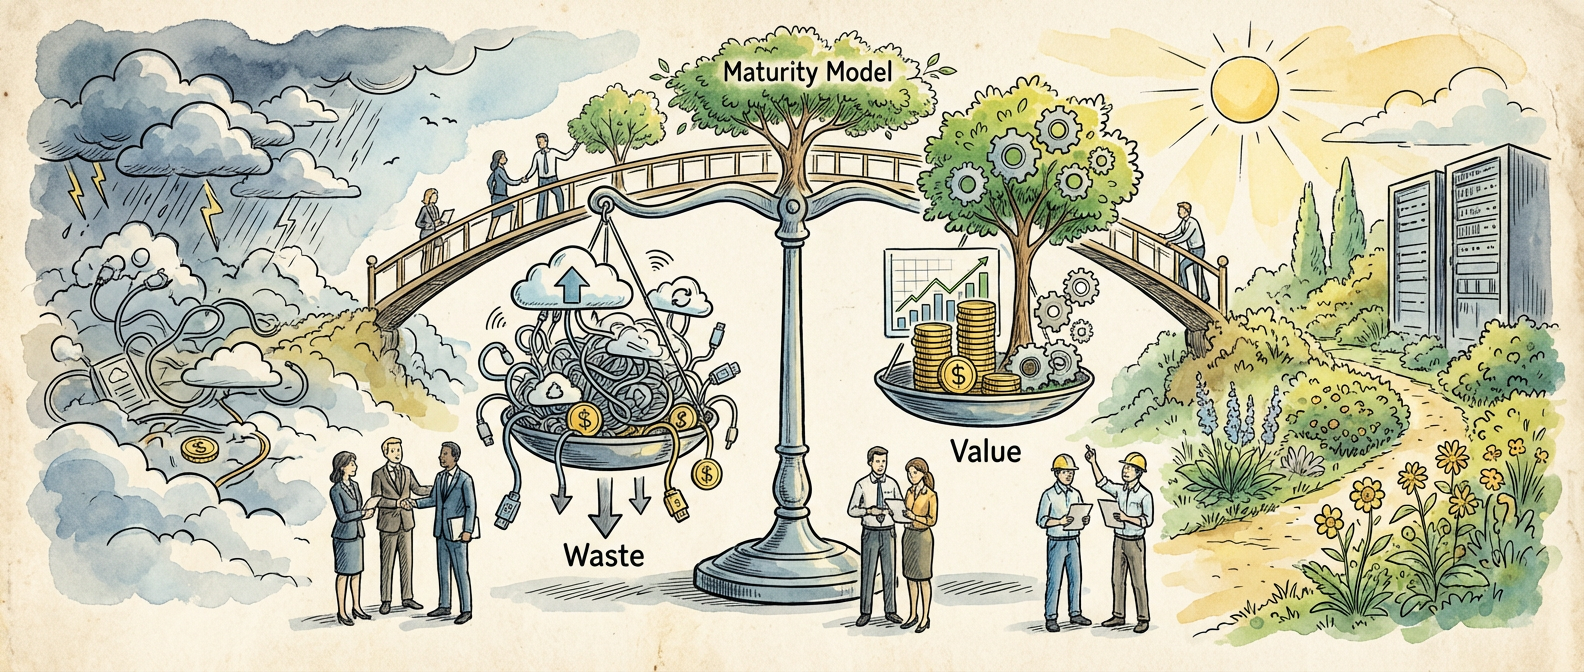
Illustration for The Compound Interest of Code: Why Incremental Technical Debt Reduction Actually Works

The Two-Percent Rule in Practice

I call it the two-percent rule, though the exact number isn’t scientific. For every story you work on, spend roughly two percent of your time improving something adjacent to your changes. Not fixing the whole module, not rewriting the entire service, just making one small improvement. Maybe you extract a commonly used code block into a utility function. Maybe you add a missing test case. Maybe you update a confusing variable name that’s been bothering you for months.

The magic happens in aggregate. Over the course of a quarter, that two percent compounds into meaningful improvements across your entire codebase. Your team starts recognizing patterns in the debt they’re paying down. Database queries get optimized. Error handling becomes more consistent. Documentation starts appearing where it matters most. None of these changes individually move the needle, but collectively they transform the engineering experience.

I’ve seen this work in systems ranging from monolithic PHP applications handling millions of users to microservice architectures spanning dozens of teams. The key is consistency and measurement. Track your debt reduction the same way you track feature velocity. Make it visible. Celebrate the small wins. When your deployment time drops from twelve minutes to eight because someone spent an extra hour optimizing the build pipeline, that’s a victory worth acknowledging.

Strategic Debt Classification

Not all technical debt deserves equal attention. This is where most teams waste enormous amounts of effort. They’ll spend weeks refactoring a rarely-touched admin interface while leaving critical payment processing code held together with string and prayer. Effective debt management requires ruthless prioritization based on actual business impact and engineering pain.

I categorize debt into three buckets: blockers, friction, and cosmetic. Blockers prevent you from shipping features or cause production incidents. They get immediate attention regardless of sprint planning. Friction slows down development velocity or makes certain types of changes disproportionately expensive. This is where the two-percent rule shines. Cosmetic debt makes the code ugly but doesn’t materially impact functionality or development speed. It gets addressed only when you’re already touching that code for other reasons.

The classification isn’t permanent. Friction debt becomes blocker debt when you need to implement a feature that touches all the messy parts of your system. Cosmetic debt becomes friction debt when new team members start asking why the authentication service has seventeen different ways to validate user sessions. Regular reassessment keeps your efforts focused on what actually matters to your team’s ability to deliver value.

Building Institutional Memory Around Debt

The most sophisticated technical debt management I’ve encountered treats debt like an ongoing architectural conversation rather than a series of isolated fixes. Teams maintain living documentation about their debt landscape. Not comprehensive inventories that go stale immediately, but focused narratives about the big design decisions that created lasting consequences.

This documentation helps in multiple ways. It prevents teams from repeatedly encountering the same problems without understanding their root causes. It helps new engineers understand why certain parts of the system feel awkward or overly complex. Most importantly, it creates shared context for making intelligent tradeoffs between shipping quickly and maintaining long-term system health.

I recommend maintaining a simple technical debt register: a shared document listing the top ten debt items your team is actively managing, with brief explanations of their business impact and rough estimates of remediation effort. Review it monthly. Add new items when they cross the threshold from minor annoyance to material friction. Remove items when they’ve been addressed. The act of maintaining this list forces regular conversations about priorities and creates accountability for follow-through.

The Compound Returns

Teams that embrace incremental debt reduction report something unexpected: it becomes self-reinforcing. As the codebase improves, engineers naturally start holding themselves to higher standards. They begin proactively identifying debt before it accumulates into major problems. Code reviews focus more on long-term maintainability and less on immediate functionality. The culture shifts from accepting technical shortcuts to questioning whether they’re really necessary.

More importantly, these teams ship features faster, not slower. When your development environment is reliable, your deployment pipeline is smooth, and your code is easy to understand and modify, feature development accelerates. The time you invest in debt reduction pays dividends in every subsequent story your team completes. This is the compound interest of code quality, and it’s the reason why sustainable engineering velocity requires ongoing attention to technical debt.

If you’re struggling with technical debt on your team, start small. Pick one category of friction that’s been bothering everyone for months. Commit to the two-percent rule for the next sprint. Track your progress and measure the results. The improvements will be subtle at first, but I guarantee you’ll notice them compounding faster than you expect.

Production Kubernetes Deployment Strategies: What Works When You Can’t Afford Downtime

Understanding the Deployment Landscape

After watching teams struggle through botched deployments at 3 AM for the better part of a decade, I’ve come to appreciate that Kubernetes deployment strategies aren’t just theoretical constructs. They’re insurance policies against the kind of outages that make executives lose sleep and engineers question their career choices. The choice between rolling updates, blue-green deployments, and canary releases isn’t academic when you’re running services that process millions of transactions daily.

Production Kubernetes Deployment Strategies: What Works When You Can't Afford Downtime
Production Kubernetes Deployment Strategies: What Works When You Can’t Afford Downtime

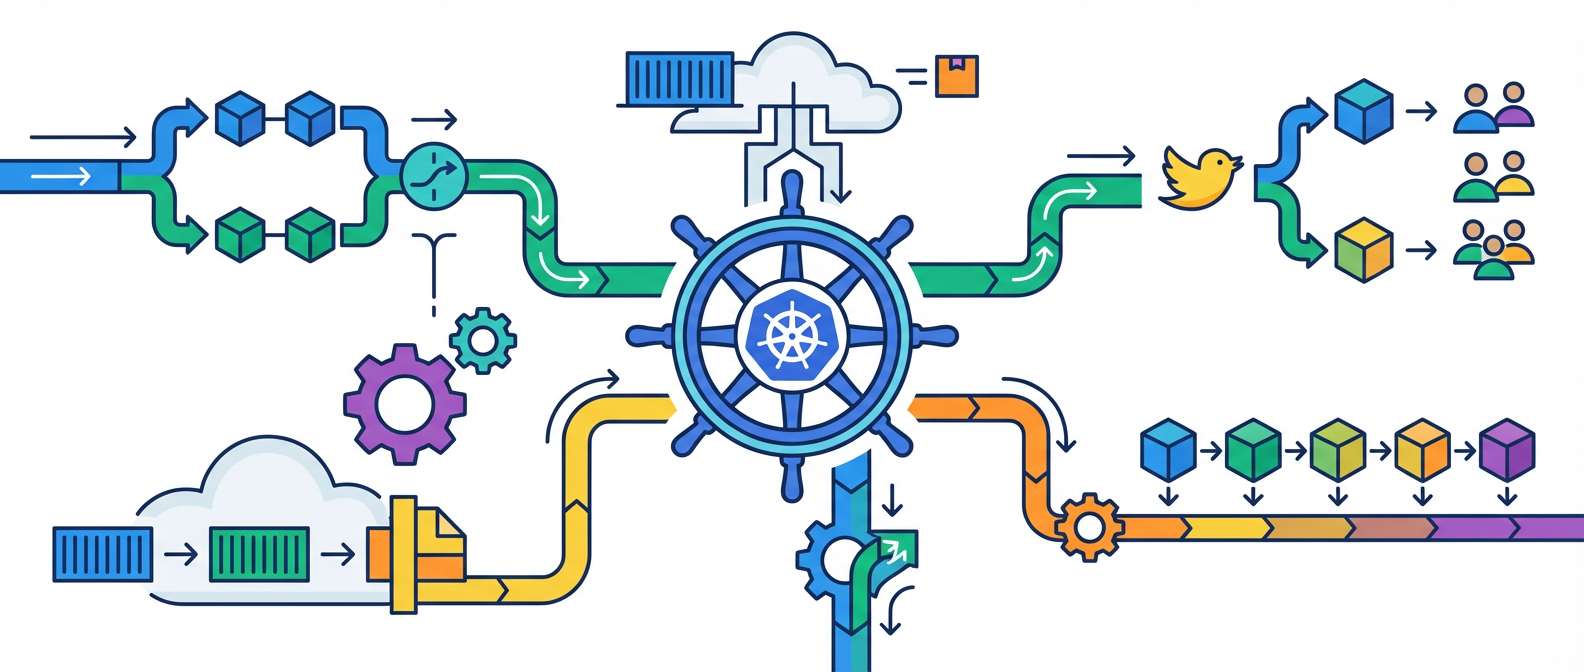
The real challenge is balancing three competing forces: deployment speed, risk mitigation, and resource efficiency. Rolling updates give you speed and efficiency but limited blast radius control. Blue-green deployments offer the cleanest rollback story but double your resource requirements. Canary deployments provide the most sophisticated risk management but require additional infrastructure complexity. Each strategy makes specific tradeoffs that align better with certain operational realities.

What I’ve learned is that successful production deployments start with honest conversations about your actual constraints. How much additional infrastructure can you afford to keep idle? What’s your mean time to detection for application-level issues? How quickly can your team respond to alerts during off-hours? These operational realities should drive your strategy selection more than architectural preferences or what worked at your last company.

Illustration for Production Kubernetes Deployment Strategies: What Works When You Can't Afford Downtime
Illustration for Production Kubernetes Deployment Strategies: What Works When You Can’t Afford Downtime

Rolling Updates: The Default Choice That Needs Respect

Rolling updates are Kubernetes’ default deployment strategy, and there’s wisdom in that choice. The mechanism is elegantly simple: gradually replace old pod instances with new ones while maintaining service availability through load balancing. The deployment controller manages this process by creating new replica sets while scaling down old ones, respecting the maxUnavailable and maxSurge parameters you’ve configured.

Rolling updates shine because of their resource efficiency. You’re never running significantly more infrastructure than your steady-state requirements, which matters when you’re operating at scale or working within tight budget constraints. I’ve seen teams successfully run rolling updates for applications serving hundreds of thousands of users without major incident, provided they’ve done the foundational work around health checks and graceful shutdown handling.

However, rolling updates demand respect for their limitations. The gradual nature of the rollout means that problematic versions can affect real traffic before you detect issues. If your new version introduces a memory leak or breaks an important integration, some percentage of your users will experience that failure before your monitoring catches it. This is why proper readiness probes, comprehensive monitoring, and fast rollback procedures become non-negotiable with this strategy.

The configuration details matter more than many teams realize. Setting appropriate values for maxUnavailable and maxSurge requires understanding your application’s startup characteristics and resource requirements. A slow-starting application with high memory requirements needs different tuning than a lightweight service that reaches readiness in seconds. I’ve debugged deployment failures that traced back to surge settings that overwhelmed cluster capacity or unavailable thresholds that violated SLA requirements.

Blue-Green Deployments: When You Need the Nuclear Option

Blue-green deployments work on a completely different principle: maintain two identical production environments and switch traffic between them instantly. In Kubernetes, this typically means running parallel deployments and using service selectors or ingress configurations to direct traffic. The approach provides the cleanest possible rollback story since your previous version remains completely intact and ready for immediate reactivation.

The operational advantages become clear when you’re dealing with mission-critical applications or complex stateful workloads. Database migrations, schema changes, or applications with long startup times benefit enormously from the blue-green approach. You can fully validate the new environment under production conditions before directing any user traffic to it. When issues arise, rollback happens in seconds rather than minutes, which can be the difference between a minor incident and a major outage.

Resource requirements are the primary constraint for blue-green deployments. You’re effectively doubling your infrastructure footprint during deployment windows, which creates both cost and capacity implications. For resource-intensive applications or teams operating in constrained environments, this overhead can be prohibitive. I’ve worked with organizations where the blue-green resource requirements exceeded their cluster capacity, making the strategy technically impossible without significant infrastructure investment.

Implementation complexity also increases substantially with blue-green approaches. You need sophisticated traffic routing mechanisms, comprehensive environment validation procedures, and coordination between multiple system components. Database state synchronization becomes particularly challenging when dealing with stateful applications. The operational overhead of maintaining two production-grade environments simultaneously requires mature DevOps practices and experienced team members.

Canary Deployments: Sophisticated Risk Management

Canary deployments are the most nuanced approach to production rollouts, gradually exposing new versions to increasing percentages of production traffic while monitoring key metrics for signs of regression. This strategy provides the best balance between rapid feedback and limited blast radius, but requires sophisticated tooling and monitoring infrastructure to implement effectively.

The core insight behind canary deployments is that many production issues reveal themselves through subtle changes in application behavior rather than outright failures. Increased latency, higher error rates, or degraded user experience metrics often appear before complete service failures. By routing small percentages of traffic to new versions while continuously monitoring these indicators, you can detect problems early and halt rollouts before they affect significant user populations.

Successful canary implementations depend heavily on comprehensive observability infrastructure. You need real-time metrics collection, alerting systems that can detect subtle regressions, and automated rollback capabilities triggered by threshold violations. The tooling complexity increases dramatically compared to simpler deployment strategies. Service meshes like Istio or dedicated canary deployment tools like Flagger become essential infrastructure components rather than nice-to-have additions.

Traffic splitting mechanisms also require careful consideration. Simple percentage-based routing works for many scenarios, but sophisticated applications might need routing based on user attributes, geographic regions, or feature flags. The implementation details significantly impact both the effectiveness of your risk mitigation and the complexity of your operational procedures. I’ve seen teams struggle with canary deployments that worked perfectly in staging but failed to detect issues in production because of insufficient traffic routing sophistication.

Choosing Your Path Forward

The deployment strategy that works for your organization depends on your specific operational context, risk tolerance, and infrastructure constraints. Teams with mature monitoring and rapid incident response capabilities can often succeed with well-tuned rolling updates. Organizations with strict availability requirements and sufficient resources frequently benefit from blue-green approaches. Applications with complex behavior patterns and sophisticated DevOps teams may find canary deployments provide the optimal risk-reward balance.

The most important lesson I’ve learned is that deployment strategy selection isn’t a one-time decision. As your applications evolve, your team matures, and your infrastructure grows, the optimal approach may change. Start with the simplest strategy that meets your requirements, invest in the foundational capabilities that enable more sophisticated approaches, and evolve your practices as your operational context changes.

What deployment challenges have shaped your production experiences? I’m always interested in hearing how different teams navigate these tradeoffs in their specific operational contexts.

The Hard Lessons of Kubernetes Production Deployments: What Five Years in the Trenches Taught Me

Rolling Updates: The Seductive Trap That Nearly Cost Us Black Friday

When we first moved to Kubernetes in 2019, rolling updates felt like magic. The promise was simple: deploy new versions gradually, maintain availability, roll back if things go wrong. What could be more elegant? We configured our deployments with the standard 25% max unavailable, 25% max surge strategy and called it production-ready. That hubris nearly destroyed our Black Friday.

The Hard Lessons of Kubernetes Production Deployments: What Five Years in the Trenches Taught Me

The problem revealed itself during a routine deployment of our payment service. The new pods started up clean, passed their readiness checks, and began receiving traffic. But under load, a subtle memory leak in the new version caused pods to consume twice the expected memory. As rolling updates progressed, nodes began experiencing memory pressure. The kubelet started evicting pods, including healthy ones from other services.

What followed was a cascade failure that took down three services. The rolling update had succeeded technically, but it had poisoned our cluster. We learned that day that readiness checks and resource limits aren’t enough. You need real load testing, proper resource quotas per namespace, and honestly, the discipline to deploy during low-traffic windows even when the technology promises you don’t need to.

Now our rolling updates include mandatory soak periods, gradual traffic shifting through our service mesh, and automatic rollback triggers based on error rates and latency percentiles. The magic is still there, but it’s tempered by hard-won wisdom about what can go wrong when you’re processing millions of dollars in transactions.

Blue-Green Deployments: When Zero Downtime Actually Matters

After the Black Friday incident, we knew we needed a more controlled approach for our most important services. Blue-green deployments became our safety net, but implementing them properly in Kubernetes required rethinking our entire traffic management strategy. The concept is straightforward: maintain two identical production environments, deploy to the inactive one, then switch traffic over. The devil lives in the orchestration details.

Our first attempt used simple Service label selectors to switch between blue and green deployments. This worked for stateless services but created chaos for anything that touched persistent storage or maintained long-lived connections. Database connections would hang, file uploads would fail, and WebSocket connections would drop. We realized that true blue-green deployments require careful planning of every stateful component in your system.

The solution involved multiple layers: application-level connection draining, database connection pooling with automatic failover, shared persistent volumes mounted read-only where possible, and a sophisticated ingress controller that could perform weighted traffic switching. We also implemented pre-switch validation that would automatically test important user journeys against the green environment before any traffic moved.

Today, our blue-green deployments for the payment and authentication services have achieved genuine zero-downtime releases. But the infrastructure cost is nearly double that of rolling updates, and the complexity means only our most senior engineers can execute them confidently. It’s a trade-off we make gladly for services where even a few seconds of downtime costs thousands of dollars.

Canary Releases: The Art of Controlled Risk

Canary deployments sit in the sweet spot between the simplicity of rolling updates and the safety of blue-green strategies. After mastering blue-green deployments, we turned to canaries for services where we needed more flexible risk management. The goal was to expose new code to real production traffic but limit the blast radius if things went wrong.

Our canary implementation evolved through several iterations. Initially, we used basic weighted routing through an ingress controller, sending 5% of traffic to the new version. This caught obvious bugs but missed subtle issues that only appeared under specific load patterns or for particular user segments. We learned that effective canary deployments require sophisticated traffic shaping and rock-solid observability.

The breakthrough came when we integrated our canary system with our feature flag platform and telemetry infrastructure. Now our canaries don’t just route traffic randomly; they intelligently select traffic based on user cohorts, request characteristics, and real-time performance metrics. If error rates spike or latency degrades beyond our thresholds, the system automatically shifts traffic back to the stable version.

We’ve also learned to pair canaries with synthetic transaction monitoring. Before any real user traffic hits a canary deployment, automated tests simulate core user journeys and validate that important functionality works correctly. This catches integration failures and configuration errors that might not surface during initial health checks but would cause user-facing problems.

GitOps and Deployment Orchestration: Building Trust Through Automation

The most transformative change in our deployment strategy wasn’t a new technique but rather how we orchestrated and governed our existing approaches. Manual deployments, even with excellent runbooks, introduced too much human error and made it difficult to maintain consistency across our growing number of services.

We implemented GitOps using ArgoCD, treating our Kubernetes manifests as the single source of truth for what should be running in production. Every deployment now follows the same pattern: code changes trigger CI pipelines that build images and update Helm charts, those changes are committed to our GitOps repository, and ArgoCD automatically applies them to the cluster. This eliminated the “it worked on my machine” problem and gave us complete audit trails for every production change.

The real power emerged when we integrated our deployment strategies into this GitOps workflow. Different services use different strategies based on their importance and characteristics, but the orchestration is consistent. Our payment service gets blue-green deployments with extensive pre-switch validation. User-facing APIs get canary releases with automated rollback. Background workers use rolling updates with careful resource management.

Building this level of automation required months of work, but it paid dividends in reliability and developer confidence. Our deployment success rate improved from roughly 85% to over 99%, and the time to detect and resolve deployment issues dropped from hours to minutes. More importantly, we democratized safe deployments across our engineering team without requiring everyone to become Kubernetes experts.

The Lessons That Stick

After five years of Kubernetes production deployments, the strategies matter less than the discipline around them. Rolling updates work beautifully until they don’t. Blue-green deployments provide safety at the cost of complexity. Canaries offer the best balance of risk and simplicity but require sophisticated observability. The key insight is that no single strategy fits every situation, and the real skill lies in choosing the right approach for each service and context.

What matters most is having robust monitoring, clear rollback procedures, and the organizational discipline to use them. The fanciest deployment strategy in the world won’t save you if you don’t know when something is going wrong or how to fix it quickly. Start simple, measure everything, and evolve your strategies based on real production experience rather than theoretical benefits.

Every production system is unique, and what works for us might not work for you. But the principles remain constant: minimize blast radius, maintain observability, automate what you can, and always have a way back. If you’re wrestling with similar challenges or have war stories of your own, I’d love to hear about your experiences in the comments below.

The IDE Battlefield of 2026: Where Developer Tools Are Heading Next

The Established Giants Hold Their Ground

The development environment landscape in 2026 shows a weird mix of things staying exactly the same and getting completely turned upside down. Microsoft’s Visual Studio Code still dominates, grabbing about three-quarters of the web development market. This isn’t just because people are lazy about switching tools. VS Code’s plugin system, plus Microsoft throwing serious money at developer experience, has turned it into something closer to a platform than just another text editor.

JetBrains keeps its stranglehold on enterprise development, especially anywhere Java and Kotlin matter. The JetBrains developer survey keeps showing that companies building big, complex applications that need to stick around still want IDEs with serious language smarts and refactoring that actually works. This split tells me the “one tool for everything” dream might be dead.

What gets me is how these big players have managed to stay relevant. VS Code’s plugin world has basically become an operating system for writing code. JetBrains went the other direction and doubled down on what they’re actually good at: building IDEs that understand your code better than you do, in ways that general editors just can’t match.

The Performance Revolution and New Contenders

Performance became the thing everyone cares about now, and that’s where the real innovation is happening. Zed editor is the perfect example of how raw speed can make you stand out in a crowded field. Built with Rust and designed for collaborative editing from day one, Zed appeals to developers who are sick of watching Electron apps eat their RAM.

This performance-first mentality shows a bigger shift toward tools that don’t treat your computer like garbage while still doing clever things. Zed’s success with speed-obsessed developers proves the market will reward tools that prioritize being fast over having every possible feature. We’re past caring about startup time. Now it’s about staying responsive when you’re juggling massive codebases or running multiple dev environments at once.

These performance-focused alternatives also show that developers have grown up. We’ve all dealt with autocomplete that stutters or file operations that make you want to throw your laptop. People will learn new tools if those tools actually make their day better in measurable ways.

AI Integration Reshapes Development Culture

The biggest change in development tools isn’t really about the editors at all. It’s about how AI is completely changing how we write code. AI pair programming in tools like Cursor and GitHub Copilot is messing with everything from code reviews to basic workflow.

AI help has moved way past just finishing your function names. Now it’s influencing how we think about architecture and testing. Developers I know say AI-assisted coding is changing not just how they write code, but how they think about structuring and maintaining it. This really shows up in code reviews, where we’ve stopped looking for typos and started debating whether the AI’s suggestions are actually good ideas.

What makes this really interesting is how it’s leveling the playing field. Junior developers can get advice that used to take years to learn, while senior developers can explore new areas without spending weeks reading documentation. The VS Code documentation now has huge sections on AI integration, which shows how central this stuff has become to modern development.

The Terminal Renaissance and Vim’s Second Act

While everyone’s getting excited about AI, there’s this whole other movement going the opposite direction toward terminal workflows and command-line mastery. The Neovim world has exploded, driven by developers who discovered that keyboard-only interfaces can be incredibly fast once you learn them. This isn’t about being nostalgic for the old days. It’s a deliberate choice by people who found out that mastering terminal tools gives them real productivity gains.

Neovim’s plugin ecosystem has gotten good enough to compete with traditional IDEs while keeping the speed that terminal users love. Language servers, tree-sitter parsing, and smart completion have eliminated most of the old trade-offs between terminal editors and graphical IDEs.

This terminal-first movement also reflects wanting tools that you can customize completely and automate however you want. Developers managing complex deployments or juggling multiple projects often find that terminal workflows play better with their other tools than graphical apps that live in their own little world.

Market Pressures and the Automation Paradox

Low-code platforms are creating an interesting problem for traditional development tools. These platforms keep getting better at handling routine app development that used to require real coding skills. This is putting pressure on the whole developer job market, especially entry-level positions where simple CRUD apps and basic integrations might get automated away completely.

But this automation thing cuts both ways and is actually driving innovation in professional development tools. As routine tasks get automated, the leftover development work gets more complex and specialized. This creates opportunities for tools that can handle sophisticated architectural problems, performance optimization, and system integration that low-code platforms can’t touch.

The IDE wars of 2026 are really about getting ready for a world where human developers focus on increasingly complex problems while automation handles the boring stuff. The tools that win will be the ones that make human creativity and problem-solving better, not just automate what we’re already doing.

The development tool world keeps changing fast, with new players challenging the old guard and AI integration changing basic assumptions about how code gets written. As this speeds up, developers who keep track of new tools and workflows will be better prepared for whatever 2027 throws at us. What development tools are you trying out, and how are they changing your daily routine?

How Open Source Software Powers Everything You Use Online

The Invisible Foundation of Digital Life

When you check your email, stream a video, or make an online purchase, you’re interacting with a vast network of servers and applications. What you might not realize is that nearly all of this digital infrastructure runs on software that anyone can freely examine, modify, and distribute. This is open source software, and it forms the backbone of modern computing in ways that would surprise most users.

Here’s a stat that blew my mind: Linux, an open source operating system, powers more than 96 percent of the world’s top one million web servers. That means almost every website you visit, every app you download, and every cloud service you use relies on software that thousands of volunteers and companies have built together over decades. The collaborative nature of open source has created technology that’s often more reliable, secure, and innovative than proprietary alternatives.

Understanding open source software isn’t just about technical curiosity. It’s about grasping how the digital world actually works and why this collaborative model has become so important to modern infrastructure. For anyone new to technology or considering a career in software, open source represents both the foundation you’ll build upon and a philosophy that shapes how modern software development happens.

The Economic Engine Behind Free Software

The term “free” in open source can be misleading. While the software itself costs nothing to download and use, it generates enormous economic value. Technologies like Apache web servers, Nginx load balancers, and PostgreSQL databases underpin billions of dollars in enterprise revenue annually. Major corporations from Google to Goldman Sachs rely on these tools to run their core business operations.

This creates an interesting paradox: software that anyone can use for free has become essential to the most valuable companies in the world. The Open Source Initiative has helped establish the legal and philosophical frameworks that make this possible, ensuring that open source licenses protect both users and contributors while encouraging innovation.

Companies have discovered that contributing to open source projects often makes more business sense than building everything from scratch. When hundreds or thousands of developers collaborate on a project, the resulting software tends to be more robust and feature-rich than what any single company could create alone. This collaborative approach has led to some of the most important technologies of our time, from the Linux kernel to machine learning frameworks like TensorFlow.

The Human Cost of Digital Infrastructure

Behind every successful open source project are real people who write code, fix bugs, and respond to user questions. Many of these maintainers started as hobbyists or students, gradually becoming responsible for software that millions of users depend on daily. This responsibility can become overwhelming, leading to burnout among maintainers who often receive little compensation for their important work.

The tech industry has begun recognizing this sustainability crisis. Major corporations now fund open source projects directly, hire maintainers full-time, and create dedicated teams to contribute to projects. GitHub Open Source programs and initiatives like GitHub Sponsors have distributed over thirty million dollars to project maintainers, helping ensure that essential infrastructure remains maintained and secure.

For newcomers to open source, this represents both opportunity and responsibility. Contributing to open source projects can launch careers, build valuable skills, and create meaningful connections within the tech community. However, it’s important to approach these contributions thoughtfully, understanding that maintainers are often volunteers juggling multiple responsibilities.

New Challenges and Changing Standards

The increasing reliance on open source software has attracted regulatory attention. The European Union’s Cyber Resilience Act introduces new liability requirements that could significantly impact how open source projects operate. These regulations aim to improve software security but raise questions about whether volunteer-driven projects can meet the same standards expected of commercial software companies.

At the same time, the technical landscape keeps changing. Rust, a modern programming language focused on memory safety, is gradually replacing C in safety-critical systems throughout the Linux kernel and major cloud platforms like Amazon Web Services. This shift shows both the open source community’s commitment to improvement and the challenges of updating foundational technologies that billions of devices depend on.

These changes highlight why understanding open source matters for anyone entering the tech field. The software industry increasingly values contributors who can navigate both technical challenges and the social dynamics of collaborative development. Learning to contribute effectively to open source projects teaches skills that transfer directly to professional software development.

Getting Started in the Open Source World

For those new to programming or considering their first open source contributions, the key is starting small and choosing projects aligned with your interests and skill level. Documentation improvements, bug reports, and small additions provide valuable learning opportunities without overwhelming project maintainers. Many projects specifically label issues as “good first issue” or “beginner-friendly” to help newcomers get started.

The most successful open source contributors often begin by using projects extensively before attempting to contribute. This user experience provides important context for understanding how improvements can help real people solve actual problems. Whether you’re interested in web development, data science, mobile apps, or system administration, there are open source projects that can help you learn while making meaningful contributions.

Remember that open source contribution extends beyond writing code. Testing software, improving documentation, helping other users, and even providing feedback on user experience all represent valuable contributions. The collaborative nature of open source means there are many ways to participate, regardless of your current technical skill level.

The open source ecosystem keeps growing and changing, creating new opportunities for both seasoned developers and complete beginners. Whether you’re curious about how your favorite apps work, interested in building technical skills, or wanting to contribute to software that millions of people use daily, the open source world offers a welcoming entry point into the world of collaborative software development.

The Real Picture on Cloud cost optimisation and FinOps maturity

Most approaches to understanding cloud cost optimization and FinOps maturity break down at the same predictable point. I’ve looked at the evidence carefully, and it tells a much more specific story. There’s a better way to frame this, and it leads to better predictions.

Here’s what actually matters: FinOps Foundation membership grew 200 percent in two years. Forget the headline numbers. When you look at this through the lens of discovery and recommendation, the enthusiastic but credible read is also the most accurate one.

The Real Picture on Cloud cost optimisation and FinOps maturity

The Recommendation: Setting the Terms

Cloud waste at 32 percent of total cloud spend in 2025 isn’t just another data point. It’s the structural condition that makes everything else in this analysis make sense. This kind of context doesn’t age quickly. The conditions that created it have been building for years, and their convergence is what makes right now different from previous moments that looked similar from a distance.

FinOps Foundation membership grew 200 percent in two years. Reserved instance and savings plan adoption is reducing bills 40-60 percent. Look at both together and a pattern emerges that the FinOps Foundation has been tracking from the inside: these conditions are more durable than they first appear, and the implications reach further than the immediate headlines suggest.

To understand why this matters, compare what was true three years ago to what’s true now. The change isn’t just quantitative, it’s qualitative. The participants, the infrastructure, and the incentive structures have all shifted in ways that build on each other rather than cancel out. That compounding effect is the most important thing to track.

What makes this moment worth examining isn’t the novelty but the confirmation. The underlying dynamics have been visible for some time. What’s new is that they’ve reached a threshold where ignoring them requires active effort rather than simple inattention. That threshold crossing is the real event, not the underlying movement that produced it.

Spot and preemptible instances now power the majority of ML training workloads. This is part of that same picture. These elements don’t exist in separate silos, they’re reinforcing conditions in the same structural shift.

The Under-the-Radar Pick: The Analysis

Here’s where the analysis gets more specific: spot and preemptible instances powering most ML training workloads. The surface reading is accessible and not wrong, but it misses the mechanism. And the mechanism is where the practical insight lives. What you should focus on isn’t the headline number but how multi-cloud strategies are becoming more common while adding operational complexity. Understanding this changes what you do with the information.

Think about what multi-cloud strategies adding operational complexity actually represents in context. This isn’t a correlation that happened to appear, it’s a downstream consequence of structural factors that have been compounding. Previous readings of similar situations failed because they treated the symptom as the cause. The structural account is less satisfying as a headline but more useful as an analytical tool.

The comparison to prior cycles is instructive precisely because of where it breaks down. Similar-looking conditions resolved differently in previous iterations because the substrate was different. Serverless compute reducing idle waste for event-driven workloads represents a substrate change, the kind that alters the elasticity of the system rather than just its current value. Recognizing that distinction separates analysis from pattern-matching.

The skeptical counterargument deserves honest engagement: prior moments with similar surface characteristics didn’t produce the outcomes that seemed logical at the time. That history is real. What’s different now is serverless compute reducing idle waste for event-driven workloads, which isn’t a minor variable, it’s the infrastructure condition that previous cycles lacked. Infrastructure changes tend to persist in ways that sentiment-driven changes don’t. AWS Cost Explorer is one source tracking this dimension with the rigor it requires.

There’s also a distributional question that often goes unaddressed in coverage of cloud cost optimization and FinOps maturity: who captures the value created by these shifts, and who absorbs the disruption costs? The aggregate picture can be positive while the distribution is uneven in ways that matter enormously to specific participants. Keeping that distributional lens in view is part of reading the situation clearly rather than simply optimistically.

Implications: What This Means If You Care About Hidden gems

The implications of cloud cost optimization and FinOps maturity extend beyond the immediate context. Cloud waste estimated at 32 percent of total cloud spend in 2025, combined with the structural conditions I described above, creates a situation where adjacent fields, decisions, and communities get affected in ways that aren’t always visible from inside the primary story. The second-order effects are frequently more important than the first-order ones, and they’re where careful attention pays the highest returns.

Here’s where my analysis departs from mainstream coverage: reserved instance and savings plan adoption reducing bills 40-60 percent is a leading indicator rather than a lagging one. The people positioned to respond to what this signals, rather than to what it confirms, are the ones who will be less surprised by what follows.

The practical response depends heavily on your position relative to the dynamics at play. For those closest to the core of cloud cost optimization and FinOps maturity, the implications are immediate and operational. For those at greater distance, the implications are strategic, a matter of understanding which adjacent pressures are building and which assumed stabilities are more fragile than they appear.

The practical question isn’t whether to engage with these dynamics but how. The answer depends on context, on what role you occupy relative to cloud cost optimization and FinOps maturity and what your actual decision horizon is. But the first step is the same regardless: accurate understanding of what’s actually happening rather than what the most available narrative says is happening.

A few concrete observations are worth separating out from the broader analysis. First: FinOps Foundation membership growing 200 percent in two years isn’t a temporary condition, it’s a new baseline. Second: multi-cloud strategies becoming more common but adding operational complexity suggests that the adjustment period isn’t over. Third, and most important: the organizations and individuals who are treating the current moment as a new steady state rather than a transition are making a categorization error that will be costly to unwind later.

The Case Against: What the Critics Get Right

Intellectual honesty requires acknowledging the strongest counterarguments, not just the weakest ones. The case against the optimistic reading of cloud cost optimization and FinOps maturity isn’t trivial. There are structural vulnerabilities in the current picture that deserve direct engagement rather than dismissal.

The most serious objection is about sustainability. Reserved instance and savings plan adoption reducing bills 40-60 percent can be read not as a foundation but as a ceiling, a point beyond which growth becomes self-limiting because of the very dynamics that produced it. If the current state has already incorporated most of the available supply of early-adopting participants, the remaining growth curve may be structurally shallower than the recent trajectory implies.

There’s also the policy and regulatory dimension. Cloud waste estimated at 32 percent of total cloud spend in 2025 describes a condition in a relatively permissive environment. Regulatory responses to the scale implied by these numbers aren’t inevitable, but they’re not implausible either. The organizations that are planning as though the current regulatory environment is permanent are making an assumption that the history of fast-growing sectors doesn’t support.

The rebuttal to these concerns isn’t that they’re wrong, it’s that they’re already partially priced into the current state of the field. Serverless compute reducing idle waste for event-driven workloads reflects an environment where participants are already adapting to constraints rather than operating in an unconstrained space. The adjustment capacity of the ecosystem is higher than a purely top-down view of the risks suggests.

Looking Forward

The trajectory here is clearer than the pace. Making predictions about when specific thresholds will be crossed is genuinely difficult, and anyone claiming precision about timelines should be treated with skepticism. But the direction toward cloud waste estimated at 32 percent of total cloud spend and continued development of the conditions described above is supported by evidence in a way that doesn’t depend on a single variable going right.

Serverless compute reducing idle waste for event-driven workloads is the variable to watch as the leading indicator. Historical patterns suggest it moves first, with broader metrics following with some lag. This doesn’t make the outcome certain, but it makes it readable, and readability is the precondition for good decisions.

Three questions are worth holding as the story develops. First: are the structural conditions that enabled the current state durable, or are they cyclical? Second: who is positioned to benefit from the next phase, and does that differ materially from who benefited in the current phase? Third: what would a clean falsification of the optimistic thesis look like, and is there any evidence of that signal emerging? These questions don’t need answers today, but having asked them changes what you notice in the months ahead.

The analysis holds up under scrutiny, which is the only test that matters. The current moment in cloud cost optimization and FinOps maturity is one where the people who have built an accurate model of the underlying dynamics are better positioned than the people who are relying on the surface story. Building that model isn’t a quick task, but it is a doable one, and this analysis is intended as one input into it.

What’s in your personal toolkit that nobody talks about?

Open source software sustaining modern infrastructure: First-hand experience report

The evidence tells a specific story. Open source software keeps modern infrastructure running, and this deserves more attention than it usually gets. The reason is simple once you look at the details.

What matters isn’t the big headline numbers but the real-world experience. Apache, Nginx, and PostgreSQL power billions in enterprise revenue. When you dig into what’s actually happening, this becomes clear.

The Report: Setting the Terms

Linux runs over 96 percent of the world’s top 1 million web servers. This isn’t just another statistic about open source software keeping infrastructure running—it’s the foundation that makes everything else in this analysis make sense. This kind of dominance doesn’t happen overnight. The conditions creating it have been building for years, and they’re converging in ways that make now different from previous moments that might have looked similar.

Apache, Nginx, and PostgreSQL power billions in enterprise revenue while FOSS burnout is pushing companies into adoption programs and funding pledges. Look at both together and you see a pattern the Open Source Initiative has been tracking from the inside. These conditions are stickier than they first appear, and the implications go beyond the immediate headlines.

To understand why this matters, compare what was true three years ago to what’s true now. The change isn’t just bigger numbers—it’s different in kind. The players, the infrastructure, and the incentives have all shifted in ways that build on each other rather than cancel out. That compounding effect is what you need to track.

What makes this moment worth examining isn’t that it’s new, but that it confirms what’s been building. The underlying dynamics have been visible for a while. What’s new is that they’ve reached a point where ignoring them takes real effort rather than simple inattention. Crossing that threshold is the real event, not the movement that created it.

GitHub’s sponsors program has paid out over $30 million to maintainers, and that’s part of the same picture. These aren’t separate developments—they’re reinforcing parts of the same structural shift.

The War Story: The Analysis

GitHub’s $30 million payout to maintainers is where this gets specific. The surface reading is accessible and not wrong, but it misses how this actually works. And the mechanism is where the practical insight lives. What matters isn’t the headline number but how the EU Cyber Resilience Act is putting new liability pressure on open source projects. Understanding that changes what you do with the information.

Consider what the EU Cyber Resilience Act pressure represents in context. This isn’t a random correlation—it’s a downstream result of structural factors that have been compounding. Previous attempts to read similar situations failed because they treated the symptom as the cause. The structural account is less satisfying as a headline but more useful for actually understanding what’s happening.

Comparing this to previous cycles is instructive because of where the comparison breaks down. Similar-looking conditions resolved differently before because the underlying infrastructure was different. Rust replacing C in safety-critical systems across the Linux kernel and AWS represents an infrastructure change—the kind that alters how elastic the system is, not just its current state. Recognizing that distinction separates real analysis from pattern-matching.

The skeptical counterargument deserves honest engagement. Previous moments with similar surface characteristics didn’t produce the outcomes that seemed logical at the time. That history is real. What’s different now is Rust replacing C in safety-critical systems across the Linux kernel and AWS. This isn’t a minor variable—it’s the infrastructure condition that previous cycles lacked. Infrastructure changes tend to stick in ways that sentiment-driven changes don’t. GitHub Open Source tracks this dimension with the rigor it requires.

There’s also a question that often goes unaddressed in coverage of open source software keeping infrastructure running: who captures the value created by these shifts, and who absorbs the disruption costs? The big picture can be positive while the distribution is uneven in ways that matter enormously to specific participants. Keeping that lens in view is part of reading the situation clearly rather than just optimistically.

Implications: What This Means If You Care About Incident reports

The implications of open source software keeping modern infrastructure running extend beyond the immediate context. Linux powering over 96 percent of the world’s top 1 million web servers, combined with the structural conditions described above, creates a situation where adjacent fields, decisions, and communities get affected in ways that aren’t always visible from inside the primary story. The second-order effects are frequently more important than the first-order ones, and they’re where careful attention pays the highest returns.

The frame that matters here—and this is where the analysis departs from mainstream coverage—is that FOSS burnout forcing corporate adoption programs and funding pledges is a leading indicator rather than a lagging one. The people positioned to respond to what this signals, rather than to what it confirms, are the ones who will be less surprised by what follows.

The practical response depends heavily on your position relative to these dynamics. For those closest to the core of open source software keeping modern infrastructure running, the implications are immediate and operational. For those at greater distance, the implications are strategic—a matter of understanding which adjacent pressures are building and which assumed stabilities are more fragile than they appear.

The practical question isn’t whether to engage with these dynamics but how. The answer depends on context—on what role you occupy relative to open source software keeping modern infrastructure running and what your actual decision horizon is. But the first step is the same regardless: accurate understanding of what’s actually happening rather than what the most available narrative says is happening.

A few concrete observations are worth separating out from the broader analysis. First: Apache, Nginx, and PostgreSQL powering billions in enterprise revenue isn’t a temporary condition—it’s a new baseline. Second: the EU Cyber Resilience Act putting new liability pressure on open source projects suggests that the adjustment period isn’t over. Third, and most important: the organizations and individuals who are treating the current moment as a new steady state rather than a transition are making a categorization error that will be costly to unwind later.

The Case Against: What the Critics Get Right

Intellectual honesty requires acknowledging the strongest counterarguments, not just the weakest ones. The case against the optimistic reading of open source software keeping modern infrastructure running isn’t trivial. There are structural vulnerabilities in the current picture that deserve direct engagement rather than dismissal.

The most serious objection is about sustainability. FOSS burnout forcing corporate adoption programs and funding pledges can be read not as a foundation but as a ceiling—a point beyond which growth becomes self-limiting because of the very dynamics that produced it. If the current state has already incorporated most of the available supply of early-adopting participants, the remaining growth curve may be structurally shallower than the recent trajectory implies.

There’s also the policy and regulatory dimension. Linux powering over 96 percent of the world’s top 1 million web servers describes a condition in a relatively permissive environment. Regulatory responses to the scale implied by these numbers aren’t inevitable, but they aren’t implausible either. The organizations planning as though the current regulatory environment is permanent are making an assumption that the history of fast-growing sectors doesn’t support.

The rebuttal to these concerns isn’t that they’re wrong—it’s that they’re already partially priced into the current state of the field. Rust replacing C in safety-critical systems across the Linux kernel and AWS reflects an environment where participants are already adapting to constraints rather than operating in an unconstrained space. The adjustment capacity of the ecosystem is higher than a purely top-down view of the risks suggests.

Looking Forward

The trajectory here is clearer than the pace. Making predictions about when specific thresholds will be crossed is genuinely difficult, and anyone claiming precision about timelines should be treated with skepticism. But the direction—toward Linux powering over 96 percent of the world’s servers and continued development of the conditions described above—is supported by the evidence in a way that doesn’t depend on a single variable going right.

Rust replacing C in safety-critical systems across the Linux kernel and AWS is the variable to watch as the leading indicator. Historical patterns suggest it moves first, with broader metrics following with some lag. This doesn’t make the outcome certain, but it makes it readable—and readability is the precondition for good decisions.

Three questions are worth holding as the story develops. First: are the structural conditions that enabled the current state durable, or are they cyclical? Second: who is positioned to benefit from the next phase, and does that differ materially from who benefited in the current phase? Third: what would a clean falsification of the optimistic thesis look like, and is there any evidence of that signal emerging? These questions don’t need answers today—but having asked them changes what you notice in the months ahead.

The analysis holds up under scrutiny—which is the only test that matters. The current moment in open source software keeping modern infrastructure running is one where the people who have built an accurate model of the underlying dynamics are better positioned than the people who are relying on the surface story. Building that model isn’t a quick task, but it’s a tractable one—and this analysis is intended as one input into it.

What’s the production failure that taught you the most? The comments are a safe space.

The Real Picture on Developer tools and the IDE wars in 2026

The evidence, examined carefully, tells a more specific story. The practical stakes of developer tools and the IDE wars in 2026 are clearest when you look at where the demand is moving, not just where it currently sits.

The data worth focusing on is not the headline number but, viewed through the lens of career intelligence, is JetBrains IDEs still dominant in enterprise Java and Kotlin development. The pragmatic read of the situation is also the more accurate one once you examine what the evidence actually shows.

The Real Picture on Developer tools and the IDE wars in 2026

The Intelligence: Setting the Terms

VS Code holds over 73 percent market share among web developers. This isn’t just a data point in the story of developer tools and the IDE wars in 2026. It’s the basic condition that explains everything else in this analysis. This kind of market position doesn’t shift quickly. The forces that created it have been building for years, and their convergence makes this moment different from previous ones that looked similar on the surface.

JetBrains IDEs still dominate enterprise Java and Kotlin development while the Zed editor gains traction with performance-focused developers. When you look at both together, a pattern emerges that VS Code documentation has been tracking from the inside: the conditions are more stable than they first appear, and the implications reach further than the immediate headlines suggest.

To understand why this matters, compare what was true three years ago to what’s true now. The change isn’t just quantitative, it’s qualitative. The players, the infrastructure, and the incentive structures have all shifted in ways that build on each other rather than cancel out. That compounding effect is the most important thing to track.

What makes this moment worth examining carefully isn’t its novelty but its confirmation. The underlying dynamics have been visible for some time. What’s new is that they’ve reached a point where ignoring them takes active effort rather than simple inattention. Crossing that threshold is the real event, not the underlying movement that produced it.

AI pair programming in Cursor and Copilot changing code review culture is part of the same picture. These elements don’t exist separately. They’re reinforcing conditions in the same structural shift.

The Career Lens: The Analysis

AI pair programming in Cursor and Copilot changing code review culture is where the analysis gets specific. The surface reading is accessible and not wrong, but it misses the mechanism. The mechanism is where the practical insight lives. The data worth focusing on isn’t the headline number but the mechanism: terminal-first developers resurging as the Neovim plugin ecosystem explodes. Understanding this changes what you do with the information.

Consider what this Neovim resurgence represents in context. It’s not a random correlation. It’s a downstream consequence of structural factors that have been building. Previous readings of similar situations failed because they treated the symptom as the cause. The structural account is less satisfying as a headline but more useful as an analytical tool.

The comparison to prior cycles is instructive precisely because of where it breaks down. Similar-looking conditions resolved differently in previous rounds because the foundation was different. What low-code platforms threatening the entry-level developer job market represents is a foundation change. The kind that alters how the system responds rather than just its current state. Recognizing that distinction separates analysis from pattern-matching.

The skeptical counterargument deserves honest engagement: prior moments with similar surface characteristics didn’t produce the outcomes that seemed logical at the time. That history is real. What’s different now is low-code platforms threatening the entry-level developer job market, which isn’t a minor variable. It’s an infrastructure condition that previous cycles lacked. Infrastructure changes tend to stick around in ways that sentiment-driven changes don’t. JetBrains developer survey is one source tracking this dimension with the rigor it requires.

There’s also a distributional question that often goes unaddressed in coverage of developer tools and the IDE wars in 2026: who captures the value created by these shifts, and who absorbs the disruption costs? The overall picture can be positive while the distribution is uneven in ways that matter enormously to specific participants. Keeping that distributional lens in view is part of reading the situation clearly rather than just optimistically.

Implications: What This Means If You Care About In-demand skills

The implications of developer tools and the IDE wars in 2026 extend beyond the immediate context. VS Code’s 73 percent market share among web developers, combined with the structural conditions described above, creates a situation where adjacent fields, decisions, and communities get affected in ways that aren’t always visible from inside the primary story. The second-order effects are frequently more important than the first-order ones, and they’re where careful attention pays the highest returns.

The frame that matters here, and this is where the analysis departs from mainstream coverage, is that Zed editor gaining traction with performance-focused developers is a leading indicator rather than a lagging one. The people positioned to respond to what this signals, rather than to what it confirms, are the ones who will be less surprised by what follows.

The practical response depends heavily on your position relative to these dynamics. For those closest to the core of developer tools and the IDE wars in 2026, the implications are immediate and operational. For those at greater distance, the implications are strategic. A matter of understanding which adjacent pressures are building and which assumed stabilities are more fragile than they appear.

The practical question isn’t whether to engage with these dynamics but how. The answer depends on context, on what role you occupy relative to developer tools and the IDE wars in 2026 and what your actual decision horizon is. But the first step is the same regardless: accurate understanding of what’s actually happening rather than what the most available narrative says is happening.

A few concrete observations are worth separating out from the broader analysis. First: JetBrains IDEs still dominating enterprise Java and Kotlin development isn’t a temporary condition. It’s a new baseline. Second: terminal-first developers resurging with the Neovim plugin ecosystem exploding suggests that the adjustment period isn’t over. Third, and most important: the organizations and individuals who are treating the current moment as a new steady state rather than a transition are making a categorization error that will be costly to unwind later.

The Case Against: What the Critics Get Right

Intellectual honesty requires acknowledging the strongest counterarguments, not just the weakest ones. The case against the optimistic reading of developer tools and the IDE wars in 2026 isn’t trivial. There are structural vulnerabilities in the current picture that deserve direct engagement rather than dismissal.

The most serious objection is the one about sustainability. The Zed editor gaining traction with performance-focused developers can be read not as a foundation but as a ceiling. A point beyond which growth becomes self-limiting because of the very dynamics that produced it. If the current state has already incorporated most of the available supply of early-adopting participants, the remaining growth curve may be structurally shallower than the recent trajectory implies.

There’s also the policy and regulatory dimension. VS Code holding over 73 percent market share among web developers describes a condition in a relatively permissive environment. Regulatory responses to the scale implied by these numbers aren’t inevitable, but they’re not implausible either. The organizations that are planning as though the current regulatory environment is permanent are making an assumption that the history of fast-growing sectors doesn’t support.

The rebuttal to these concerns isn’t that they’re wrong. It’s that they’re already partially priced into the current state of the field. Low-code platforms threatening the entry-level developer job market reflects an environment where participants are already adapting to constraints rather than operating in an unconstrained space. The adjustment capacity of the ecosystem is higher than a purely top-down view of the risks suggests.

Looking Forward

The trajectory here is clearer than the pace. Making predictions about when specific thresholds will be crossed is genuinely difficult, and anyone claiming precision about timelines should be treated with skepticism. But the direction, toward VS Code holding over 73 percent market share and continued development of the conditions described above, is supported by the evidence in a way that doesn’t depend on a single variable going right.

Low-code platforms threatening the entry-level developer job market is the variable to watch as the leading indicator. Historical patterns suggest it moves first, with broader metrics following with some lag. This doesn’t make the outcome certain, but it makes it readable. And readability is what you need for good decisions.

Three questions are worth holding as the story develops. First: are the structural conditions that enabled the current state durable, or are they cyclical? Second: who is positioned to benefit from the next phase, and does that differ materially from who benefited in the current phase? Third: what would a clean falsification of the optimistic thesis look like, and is there any evidence of that signal emerging? These questions don’t need answers today, but having asked them changes what you notice in the months ahead.

The analysis holds up under scrutiny, which is the only test that matters. The current moment in developer tools and the IDE wars in 2026 is one where the people who have built an accurate model of the underlying dynamics are better positioned than the people who are relying on the surface story. Building that model isn’t a quick task, but it’s a doable one. This analysis is intended as one input into it.

Where are you placing your skill bets for the next three years?

Developer tools and the IDE wars in 2026 — An Honest First-principles

The question worth asking about developer tools and the IDE wars in 2026 is not the one most coverage asks. The evidence, examined carefully, tells a more specific story. The more useful question, the one with real analytical leverage, is why the current situation exists at all.

The data worth focusing on is not the headline number. When you look at it through first-principles education, JetBrains IDEs are still dominant in enterprise Java and Kotlin development. The methodical read of the situation is also the more accurate one once you examine what the evidence actually shows.

Developer tools and the IDE wars in 2026 — An Honest First-principles

The Education: Setting the Terms

VS Code holds over 73 percent market share among web developers. This isn’t just a data point in the story of developer tools and the IDE wars in 2026. It’s the structural condition that makes everything else in this analysis make sense. Context like this doesn’t age quickly. The conditions that produced it have been building for years, and the convergence is what makes the current moment distinct from previous moments that looked similar from a distance.

JetBrains IDEs still dominate enterprise Java and Kotlin development while Zed editor gains ground with performance-focused developers. When you look at both together, a pattern emerges that VS Code documentation has been covering from the inside: the conditions are more durable than they first appear, and the implications extend further than the immediate headline suggests.

To understand why this matters, it helps to look at what was true three years ago versus what is true now. The difference isn’t simply quantitative, it’s qualitative. The participants, the infrastructure, and the incentive structures have all shifted in ways that compound rather than cancel out. That compounding is the most important element to track.

What makes this moment worth examining carefully is not the novelty but the confirmation. The underlying dynamics have been visible for some time. What’s new is that they’ve reached a threshold where ignoring them requires active effort rather than simple inattention. That threshold crossing is the event, not the underlying movement that produced it.

AI pair programming in Cursor and Copilot is changing code review culture as part of that same picture. These elements don’t exist in separate silos. They’re reinforcing conditions in the same structural shift.

The Deep Cut Explainer: The Analysis

AI pair programming in Cursor and Copilot changing code review culture is where the analysis gets more specific. The surface reading is accessible and not wrong, but it misses the mechanism. The mechanism is where the practical insight lives. The mechanism here is terminal-first developers making a comeback with the Neovim plugin ecosystem exploding, and understanding it changes what you do with the information.

Consider what this terminal-first resurgence with Neovim’s exploding plugin ecosystem represents in context. It’s not a correlation that happened to appear. It’s a downstream consequence of structural factors that have been compounding. Previous readings of similar situations failed because they treated the symptom as the cause. The structural account is less satisfying as a headline but more useful as an analytical tool.

The comparison to prior cycles is instructive precisely because of where it breaks down. Similar conditions resolved differently in previous iterations because the substrate was different. What low-code platforms threatening the entry-level developer job market represents is a substrate change, the kind that alters the elasticity of the system rather than just its current value. Recognizing that distinction separates analysis from pattern-matching.

The skeptical counterargument deserves honest engagement: prior moments with similar surface characteristics didn’t produce the outcomes that seemed logical at the time. That history is real. What’s different now is low-code platforms threatening the entry-level developer job market, which isn’t a minor variable. It’s the infrastructure condition that previous cycles lacked. Infrastructure changes tend to be persistent in ways that sentiment-driven changes are not. JetBrains developer survey is one source tracking this dimension with the rigor it requires.

There’s also a distributional question that often goes unaddressed in coverage of developer tools and the IDE wars in 2026: who captures the value created by these shifts, and who absorbs the disruption costs? The aggregate picture can be positive while the distribution is uneven in ways that matter enormously to specific participants. Keeping that distributional lens in view is part of reading the situation clearly rather than simply optimistically.

Implications: What This Means If You Care About Internals of common tools

The implications of developer tools and the IDE wars in 2026 extend beyond the immediate context. VS Code’s 73+ percent market share among web developers combined with the structural conditions described above creates a situation where adjacent fields, decisions, and communities are affected in ways that aren’t always visible from inside the primary story. The second-order effects are frequently more important than the first-order ones, and they’re where careful attention pays the highest returns.

The frame that matters here, and this is where the analysis departs from mainstream coverage, is that Zed editor gaining traction with performance-focused developers is a leading indicator rather than a lagging one. The people positioned to respond to what this signals, rather than to what it confirms, are the ones who will be less surprised by what follows.

The practical response depends heavily on your position relative to the dynamics at play. For those closest to the core of developer tools and the IDE wars in 2026, the implications are immediate and operational. For those at greater distance, the implications are strategic, a matter of understanding which adjacent pressures are building and which assumed stabilities are more fragile than they appear.

The practical question isn’t whether to engage with these dynamics but how. The answer depends on context, on what role you occupy relative to developer tools and the IDE wars in 2026 and what your actual decision horizon is. But the first step is the same regardless: accurate understanding of what’s actually happening rather than what the most available narrative says is happening.

A few concrete observations are worth separating out from the broader analysis. First: JetBrains IDEs still being dominant in enterprise Java and Kotlin development isn’t a temporary condition, it’s a new baseline. Second: terminal-first developers resurging with Neovim’s exploding plugin ecosystem suggests that the adjustment period isn’t over. Third, and most important: the organizations and individuals who are treating the current moment as a new steady state rather than a transition are making a categorization error that will be costly to unwind later.

The Case Against: What the Critics Get Right

Intellectual honesty requires acknowledging the strongest counterarguments, not just the weakest ones. The case against the optimistic reading of developer tools and the IDE wars in 2026 isn’t trivial. There are structural vulnerabilities in the current picture that deserve direct engagement rather than dismissal.

The most serious objection is the one about sustainability. Zed editor gaining traction with performance-focused developers can be read not as a foundation but as a ceiling, a point beyond which growth becomes self-limiting because of the very dynamics that produced it. If the current state has already incorporated most of the available supply of early-adopting participants, the remaining growth curve may be structurally shallower than the recent trajectory implies.

There’s also the policy and regulatory dimension. VS Code’s 73+ percent market share among web developers describes a condition in a relatively permissive environment. Regulatory responses to the scale implied by these numbers aren’t inevitable, but they’re not implausible either. The organizations that are planning as though the current regulatory environment is permanent are making an assumption that the history of fast-growing sectors doesn’t support.

The rebuttal to these concerns isn’t that they’re wrong, it’s that they’re already partially priced into the current state of the field. Low-code platforms threatening entry-level developer jobs reflects an environment where participants are already adapting to constraints rather than operating in an unconstrained space. The adjustment capacity of the ecosystem is higher than a purely top-down view of the risks suggests.

Looking Forward

The trajectory here is clearer than the pace. Making predictions about when specific thresholds will be crossed is genuinely difficult, and anyone claiming precision about timelines should be treated with skepticism. But the direction, toward VS Code’s continued dominance and continued development of the conditions described above, is supported by the evidence in a way that isn’t contingent on a single variable going right.

Low-code platforms threatening entry-level developer jobs is the variable to watch as the leading indicator. Historical patterns suggest it moves first, with broader metrics following with some lag. This doesn’t make the outcome certain, but it makes it readable, and readability is the precondition for good decisions.

Three questions are worth holding as the story develops. First: are the structural conditions that enabled the current state durable, or are they cyclical? Second: who is positioned to benefit from the next phase, and does that differ materially from who benefited in the current phase? Third: what would a clean falsification of the optimistic thesis look like, and is there any evidence of that signal emerging? These questions don’t need answers today, but having asked them changes what you notice in the months ahead.

The analysis holds up under scrutiny, which is the only test that matters. The current moment in developer tools and the IDE wars in 2026 is one where the people who have built an accurate model of the underlying dynamics are better positioned than the people who are relying on the surface story. Building that model isn’t a quick task, but it’s a tractable one, and this analysis is intended as one input into it.

What would you add, or correct? The comments are for exactly this.

Spaces3 — Where Technology Meets Perspective

Spaces3 — Where Technology Meets Perspective

Deep dives into software, hardware, and the ideas changing how we build things.

We cover the technical side of technology. Not just the product launches and press releases, but the architecture decisions, the tradeoffs, and the engineering culture that determines what actually gets built. The stuff that matters if you’re building things or trying to understand how they work.

Topics we cover: Software · Hardware · Developer Tools · AI & Machine Learning · Open Source · Security